Role (Group of 7)
Secondary Research Lead
Background
Achieving a goal and learning methods how to achieve a goal are two separate entities. However, the two work simultaneously. Often times, when goals are successfully reached, the method to achieve this goal is recorded, whether by conscious or unconscious decision. We want to do work in the space of teaching users how they can learn about themselves, their work styles, and learning styles through providing constructive feedback.
Goal
The goal of this project is to create a multi-platform, independent tool to motivate and coach users to achieve their desired goals. Additionally, the tool is to provide real-time feedback to aid in goal completion. Because the user group can be very broad, we are focusing on high school and college students aged 17-23. We believe the transitions from high school to college and from college to career are very goal-focused. The 4 main types of goals we are focusing on are academic, health, career, and social. While those goals are our main focus points, this tool should be usable for all sorts of goals whether short-term or long-term. The end deliverable is to provide design recommendations and mockups on how this platform could look, perform, and feel.
PRE-PROPOSAL
This stage happened before our kick-off meeting with our sponsors. At this point, we were basing our direction on the project overview packet that our professor gave us. We did some secondary research on academic tools are currently being used. We wanted to understand what works well and what doesn’t, where we ultimately identified three trends that the tools would fit into. This then influenced our first interaction with our users for the next stage of our process.
RESEARCH ROUND 1
After our kick-off meeting, we had a better idea on the expected outcomes for this project. For this stage, we conducted interviews and observations on to give us a general idea on how our users are tracking their goals. This gave us an idea on how a group of people organize their tasks, which shaped our protocol for our interviews and surveys for round 2, as well as research areas to look into.
RESEARCH ROUND 2
The goal for this stage was to be able to understand what sorts of goals people generally track and to determine who our target audience are. We sent out a survey, did observations as well as interviews, and some secondary research. Another goal for us was to verify our research data from round 1 since it was only conducted on a small amount of users.
RESEARCH ROUND 3
With a our target audience in mind, we scoped down on who we conduct our next round of surveys to. Since we now know what sorts of goals our users set, we wanted to understand how they’re tracking those goals. In addition to the surveys, we also conducted more secondary research in this stage to address the questions that came up from our data in research round 2.
DESIGN
To encapsulate all the research that we’ve conducted, we were ready to ideate and come up with how our interface could possibly look. We did some individual and team ideation through sketches and discussions, that ultimately turned into mock ups. These mock ups were then tested and iterated.
PRE-PROPOSAL
OVERVIEW
The focus of the Pre-Proposal stage in our progress was to gain a basic understanding of the current market. In order to do this, the team firstly wanted to do light research on tools that were already being used in the market and also understand what they do well and areas in which they could be improved. We analyzed 13 tools that are currently being used and used a matrix to organize them into three trends which are organization, tracking, and feedback.
Market Analysis
GOAL
Complete a market analysis to understand the current market for goal oriented digital assistants and understand what is being done well and what can be improved.
TOOLS
Purdue Forecast | Seem similar to what Microsoft wants, compares you to other classmates, tracks absence. A way for students to see how they compare to other students in their class. They receive data about themselves so they can see how they can improve. It provides automated feedback
Treehouse | checks you work and tracks your scores on different coding projects, video based and not much feedback
McGraw Hill Education Connect | EBook that gives you a quiz every so often and will quiz you over what you have recently read.
Blackboard | Tracks individual classes and what is within them, organizes grades, a platform to communicate with teachers.
Canvas | Canvas works similarly to blackboard. The use of Canvas vs. Blackboard usually depends on the institution’s choice.
Codecademy | One of the main insights from this tool is being able to see progress in the current lesson they’re in and the future lessons. It lets users know where they are in relation to the whole course.
myPurduePlan | Tells user what they have done and helps to track past classes, can be inaccurate.
My CCO | Send resume, network, see who has events on campus
Chegg | mainly for renting books and tutors but it is paid
Next Cloud | platform for where you can manually input your own add-ons (ex blackboard, file storage), Owner of content can modify at their own will.
Schoology | An educational tool used to track grades, assignments, and and discussion threads. Holds a very familiar UI that can be related back to Facebook.
Edmodo | Teachers provide students with assignments and grade assignments, activities, and quizzes, much like blackboard.
Moodle | An educational tool for tracking assignments, grades, and other events posted by the educational institution
INSIGHTS
We were able to determine the most popular attributes of these tools and come up with three different categories for three different user groups. Although each tool is different and is sanctioned for different reasons, we found similarities in the work that some of the tools are able to do and the goals that a user generally has when choosing a tool
Trends:
Organization
- Organize daily schedules or classes
- View grades
- Communicate with teachers
Tracking
- Check work
- Track scores
- Visualize progress
Feedback
- Give feedback on work
- Receive insight on ways to improve status
- Comparison to similar people
From here, we created a matrix, to help visualize the purposes of each of the tools in our market analysis, and also to help us determine direction for research and to help us better identify (at an early stage) possible attributes of our new tool.
Matrix

From this matrix the microsoft team was able to determine that there are a plethora of tools to help with organization, tracking, and feedback but each of the lacked the motivational component of a “fitbit for goals” that we had previously discussed with Rob. From this point we determined that it was time to conduct user research to help gain an understanding of our users and their experiences with motivation & organizational tools.
RESEARCH ROUND 1
OVERVIEW
Research Round 1 was focused on getting a general idea of how a group of people organize their tasks. In this section the techniques we used were observations and interviews. As a result we narrowed down the range of secondary research we wanted to conduct, and we also were able to focus our topic for Round 2 research.
INTERVIEWS AND OBSERVATIONS
GOAL
To gather information on the various ways that students interact with their academic work, in and out of the class on a mental and physical level.
PROTOCOL
Interviews
Initial interviews were informal, following a loose but consistent template. Students aged 19 to 21 from Purdue University’s West Lafayette campus were asked questions about organization and success. Interviews were conducted in study areas and common spaces throughout campus. The goal was to collect as much information as possible and analyze it later.
Observations
Observations were performed on students aged 18 to 23 on Purdue University’s West Lafayette campus in study areas and common spaces throughout campus. The goal was to collect as much information as possible and analyze it later.
FINDINGS
Organization
The majority of respondents described themselves as moderately organized; using some sort of written or digital means to track their school work–at least partially. Popular methods were short term handwritten lists, physical day planners, and simple single purpose digital solutions (notably myHomework). Whatever the tool(s), it needs to be easy to access, maintain, and refer to.
Motivation
Intrinsic motivation was the most common factor for success, according to respondents. In order to do well, the course needs to either be genuinely interesting or fit into a larger plan in order. Other forms of motivation including class rank information, progress indication, and having large problems broken into smaller tasks.
Transitions and Interaction w/ Task Management System
Participants behavior for transitioning can be divided into two categories:
- participants with task management systems
- Participants without task management systems
Participants with task management systems tended to work linearly, choosing a task from the list, working through it, and returning to the list to repeat. Participants without task management systems tended to be less focused, moving between multiple tasks without finishing them.
RESEARCH ROUND 2
OVERVIEW
Research round 2 focused on common goals, learning experiences, and research on factors that affect academic performances in order to verify data from research round 1, to understand what sorts of goals people generally track, and to scope on a user group. Techniques used to acquire such information include observations, interviews, surveys, and secondary research. As a result, user group was narrowed down to high school and college students from 17-23 years old. In addition, four categories of top goals were found to be academic, social, health, and career.
SURVEY
GOAL
We had this survey to help us scope down the age range and education level from the general public. In addition to basic understanding of common goals and demographics, we would like to look into their good learning experiences and bad learning experiences from which we can be inspired and move on to the next round of research.
PROTOCOL
What are your goals? List 3, literally anything, don’t be shy!
How old are you?
What is your gender?
Are you currently…?
Please give us an example of a good learning experience that you’ve had.
Please give us an example of a bad learning experience that you’ve had.
If you are willing to participate in the further research, please provide your email.
FINDINGS
From the survey report, we found that high school students and college students are dominated with a standard deviation of 0.08. We also were able to establish the most common genres and subgenres of goals set by our user group:
- Academic: Graduation, Grade point average, New skills (soft & hard skills), Pass classes, Pursue higher education
- Health: Exercise, Diet, Happiness, Work/Life balance
- Career: Get job, Get accepted for internships
- Social: Family, Romance, Friends
Demographics |
Number of people: 33; Age range: 17-48; Number of males: 12; Number of females: 20
INSIGHTS
We determined that a tool such as the one we are aiming to create will most benefit users in the age group 17-23 years, as this is generally a transitional period in life where goals are not only shifting from teen to young adult, but also becoming more weighted.
Although there was a wide range of diverse answers, we were able to use the results to gain insights about the user group that an organizational/goal-setting tool would most benefit.
INTERVIEWS
GOAL
We conducted interviews after doing surveys to validate the data, and to gain more in-depth data with conversational interaction in nature settings.
PROTOCOL
The questions were same as survey questions.
FINDINGS
Many students used digital calendars, paper agendas, and reminder apps. However, they are only keeping track of short-term goals or goals within a month’s time frame. Additionally, our interviewees gave us examples of their good and bad learning experiences. The results are as following:
- Good: in class activities, summarized notes, study guides, applied learning
- Bad: lack of feedback, unprepared teacher, nitpicky teachers, studying with friends
Demographics |
Number of people: 6; Age range: 19-21; Number of males: 2; Number of females: 4; Area of Study: CIT, Chemistry, Pharmacy, BCM, CNIT, UX
INSIGHTS
Across all of our interviews, we found very similar data to that in our earlier survey results. The most common goals were academic, career, health, and social. Students vary in preferences of goal tracking tools, but a common habit was found that they only track goals within a year, which means they lose sights on goals across longer period.
SECONDARY RESEARCH
GOAL
After identifying health as a goal category in our survey, we wanted to see how health played a role in academic success. Additionally, we wanted to see how long term and short term goals work together.
Digital vs. Paper/Physical Planners
Benefits of Digital Planners: Infinite space for hyper-specific details; Reminders if necessary; In more than one place (desktop, laptop, tablet, smartphone); Can be synced with the calendars of others
Benefits of Paper Planners: No digital learning curve; Simple and friendly; Less mental energy is required to write than to make a digital reminder; More motivational to constantly see goals and physically check them off; People who write down goals have a higher chance of success
Health in Relation to Success
Research conducted by the CDC show that “school health programs reduce the prevalence of health risk behaviors among young people and have a positive effect on academic performance”(Adolescent and School Health). Alongside that while emphasis is shown towards getting outside and being active, “studies show that nutritional status can directly affect mental capacity”(3 Ways Nutrition Influences Student Learning Potential and School Performance). Research also shows that balancing a healthy amount of vitamins and amino acids can increase cognitive abilities.
GPA vs. Success
In this study, the relation between GPA and success in the job was evaluated. 14 students were examined and they concluded that there is no relation between the two.
INSIGHTS
Health has a positive correlation with academic performance, so it can be a significant indicator for success. There is no one better than the other between digital and physical planners.
RESEARCH ROUND 3
OVERVIEW
In Research Round 3, we wanted to get a better understanding of how our users set and track their goals, based on our users data from research round 2. The techniques used to acquire such information include surveys, data analysis, and secondary research. As a result, user group track short term goals rather than long term goals.
SURVEY
GOAL
After receiving information on what sorts of goals people set, we wanted to understand how they set it, what mediums they use to do that, and whether or not they’re actually satisfied with that. With that, we created a new set of survey with new questions all listed below.
PROTOCOL
- How old are you?
- What’s your gender?
- What’s your ethnicity?
- What is your class level?
- Area of study (if you’re in highschool, just put “N/A”)
- How do you set your goals?
- How do you keep track of your progress?
- How satisfied are you with you goal tracking?
FINDINGS
In order to analyze our data, the entire team wrote survey answers from questions 6 and 7 on each sticky note based on how satisfied they were. There was a different color for extremely dissatisfied, somewhat dissatisfied, neither, somewhat satisfied and extremely satisfied. We then categorized the answers based on what their gender, ethnicity, and area of study. We did this to surface any patterns that could potentially influence one’s decision on how they track goals and how successful they feel like they are with that.
Demographics |
Number of people: 50; Age range: 14-23; Number of males; 30; Number of Females; 20; Undergraduate STEM Program; 64%.
INSIGHTS
Across our survey we found that people like to set their goals based on priority. Often they like to set goals for the more important aspects of their days and lives. Alongside that they find that setting and tracking their goals by both writing them down or remembering them mentally is dependent on the person.
SECONDARY RESEARCH
GOAL
After identifying what type of goals our users track in our survey, we wanted to see how the transition from high school to college could play an important role. Additionally, we wanted to know why our users track short-term goals rather than long term.
RESEARCH TOPIC 1: HIGH SCHOOL TRANSITION
Students want to know more about distinction between reporting and researching; the writing requirement in high school level is different from that in college level; the intended audience of college writing is broader than the teacher.
When high school students meet with high school counselors for a variety of reasons, they are more likely to progress through the college preparation and application process.
Appropriate help for psychological problems can positively impact on students’ well-being,academic success, and retention. Processes and care pathways need to be easily understood, user friendly, and appropriately resourced to ensure a range of services.
RESEARCH TOPIC 2: HEALTH AND LEARNING
- Users that naturally enjoy what they’re doing tend to perform better at the given task.
- Academic Success is an excellent predictor of overall well-being.
- Students with well balanced diets can help deal with behavioral problems in children.
INSIGHTS
We continue to find that college students track short term, immediately actionable goals. Furthermore, we now find that these college students seem to be content with the simple systems they have in place to track short term goals so long as they’re easy to access and use. Data specific to high school students is inconclusive for now.
DESIGN
OVERVIEW
Design is the last stage of our process this semester. This is the stage that encompasses all of our research and translated into design. During this stage, we created our personas, did some ideation, mock ups, a in-context video, and testing.
PERSONAS
GOAL
The main objective for our personas is to overall represent our research data. We decided to have three different personas to truly cover the user group that we are targeting.
PROCESS
The way we analyzed and put together the personas is to fill out six different areas: demographics, main objective, attitude, tracking method, hobbies and scenarios. Throughout these six areas, we are able to not only represent our user group, but also humanize them.
Demographics | This is to set the basic demographic of our personas.
Goal | This is the main motive our persona. This means that the majority of their efforts are going to this, essentially their long-term goal.
Attitude | These represent how they think of goal-setting in general. These are the underlying and somewhat not as visually apparent attributes of our personas.
Tracking Method | Our research show that there are three different ways our users track their goals. Each of our personas represent one of those ways.
Hobbies | We gave each of our persona a list of hobbies to be able to humanize them more and give them more personality.
Scenarios |This brings each persona to life by creating a story and showing a glimpse of how their life might be currently. We also tied this into goal-setting related scenarios to fit into our project scope.
INSIGHTS
We took these personas and aligned them to our process of approaching the design stage. This was especially helpful when creating our video on page ???? to show how one of our personas would use our application.
Personas
Tori Rucker|female | 18 | Senior at Harrison High School | West Lafayette, IN
GOAL | Academic
To get accepted into Vanderbilt for Political Science
TRACKING METHOD
Writes goals down in paper journal
ATTITUDES
Struggling to keep her priorities straight in busy times
Becoming stressed because she is used to putting out stellar work but now everything feels mediocre and unplanned
Really wants to enjoy the last parts of her senior year but she feels like she is slacking off in her schoolwork.
SCENARIO
Tori is the eldest of 6 siblings and has never been outside Lafayette, Indiana. She has a dream of attending Vanderbilt University in the fall with her childhood best friend.
Because of all her involvement in leadership roles, Tori believes that she will fit well in a political science major. The only thing that freaks her out is that she has never been a great writer and her application to Vanderbilt requires a 3 page essay.
Tori knows the steps she needs to take in order to improve her writing but with her busy senior schedule she can’t find the time to meet her writing milestones.
On top of this she is struggling to keep up with everything included in the transition from high school senior to college freshman.
IDEATION
GOAL
After creating our personas, as a team we wanted to do ideation exercises. Our goal with this was to think as a group for ideas of products we could make that would solve the needs of our users without constraining ourselves prematurely. To do this we did individual sketching activities and collaborative group thinking on the whiteboard to combine our ideas.
PROTOCOL – Sketching Activity
Before our sketching activity, as a group, we all brainstormed potential features for this product. Then, using a random generator, we assigned each team member to 2 or 3 of those potential features to sketch. We each took 7 minutes to do so, and then we each presented them to the team.
Potential Features|
The potential features we came up with are as follows:
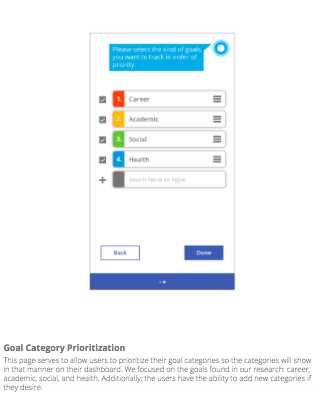
- Prioritize Goals
- Personalized Experience
- Notifications
- Progress Tracking
- Health and Fitness Integration
- Social Platform Integration
- Health, Social, Academics, & Career Goals
- Tracking Previously Completed Goals
- Self-Interest
- Self-Efficacy
- Short Term & Long Term Tracking
- Tracking Tips
- Visually Aesthetic
- Conversational Interface
- AI Integration
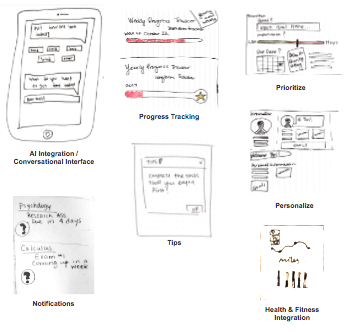
Sketching|
From there we began to sketch and came up with the following sketches:
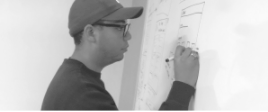
Whiteboarding|
From here we discussed them as a team and took to a whiteboard. Here we discussed interesting ways to combine our ideas into one even better idea.
INSIGHTS
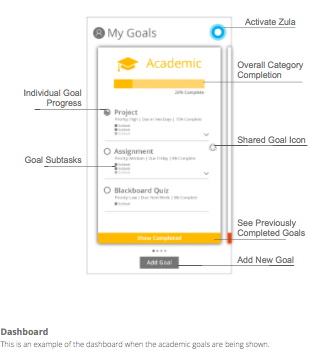
From this activity, we were able to solidify our product the features that it would offer. From here we knew that we would create a mobile app that tracks your goals in different categories that you could share with friends.
We weren’t exactly sure how to visualize these features, so that is where we moved next.
WHITEBOARD MOCKUPS
GOAL
With our whiteboard mockups we wanted to ensure we had a general idea how the application would be visualized and how it would function. Therefore, we went page by page and drew it out. Under each page, we listed the title and its purpose.

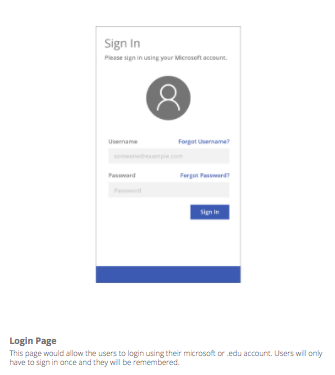
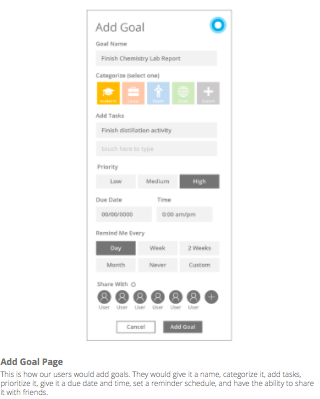
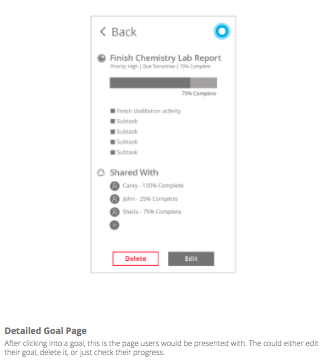
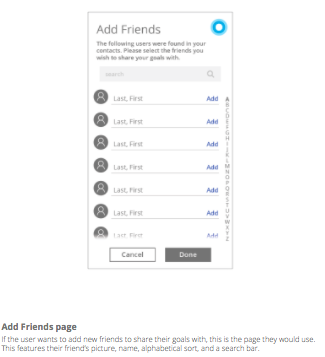
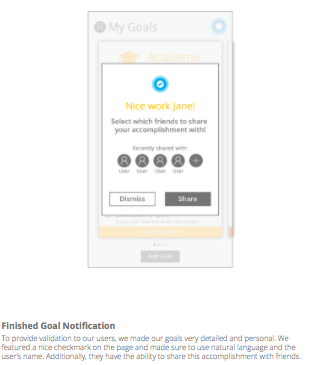
FINAL MOCKUPS
GOAL
We then took our whiteboard mockups into Adobe Illustrator and created finalized screens. We would later take these screens in for usability testing. The screens will be annotated on the following pages.

TESTING
GOAL
We then took our designs into testing to test their overall experience and the usability of the product. We constructed a detailed testing protocol to ensure all screens were being tested in the correct manner.
PROTOCOL
Hi, ___________. My name is ___________, and I’m going to be walking you through this session today. Before we begin, I have some information for you, and I’m going to read it to make sure that I cover everything. You probably do not have a good idea of why we asked you here, but let me go over it briefly. We’re asking people to try using a new goal tracking application that we’re working on. The application allows you to keep track of the goals you want and share them with friends. Additionally, there is an assistant to provide reminders and motivate you. Today, we want to see whether it works as intended and provides a pleasurable experience.
The session should take a few minutes. The first thing I want to make clear right away is that we’re testing the tool, not you. You can’t do anything wrong here. In fact, this is probably the one place today where you don’t have to worry about making mistakes. As you do the tasks, I’m going to ask you as much as possible to try to think out loud: to say what you’re looking at, what you’re trying to do, and what you’re thinking. This will be a big help to us. Also, please don’t worry that you’re going to hurt our feelings. We’re doing this to improve the tool, so we need to hear your honest reactions.
If you have any questions as we go along, just ask them. I may not be able to answer them right away, since we’re interested in how people do when they don’t have someone sitting next to them to help. But if you still have any questions when we’re done I’ll try to answer them then. And if you need to take a break at any point, just let me know. Let’s begin!
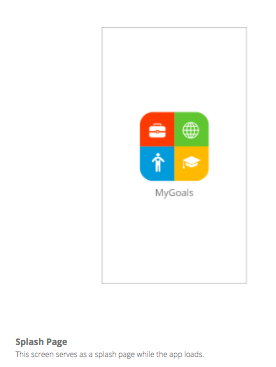
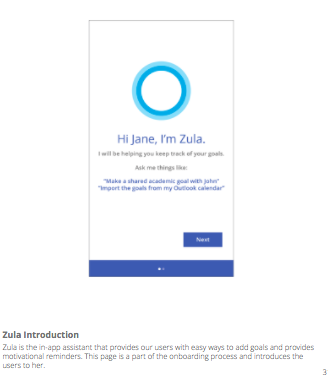
Image you have just clicked to open up the MyGoals app on your phone. You click it and you are presented with this loading page. This page will go away after a few seconds and you are presented with this screen.
Insights
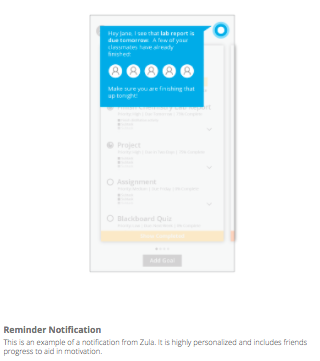
We found that this is an app that people would use, and people enjoyed the experience and the layout. However, we did find that one participant would’ve like to have a way to see her goals over a period of time. She suggested a calendar view. Also, one participant noticed the check marks didn’t match the progress bars. This is an issue with our mockups and would be fixed in reality. Additionally, we had one user not sure how she felt about Zula. In the future we would definitely recommend to do a few more tests. We want this product to grow and be iterative. However, to do that, the current version must be tested thoroughly for problems and errors.
